Business Intelligence services using Amazon QuickSight
I specialize in Data Science, Data Analysis Consulting, with a passion for unearthing insights from complex and ambiguous data for social-economic benefits across industries. Nicholas is adept at implementing the full-cycle of data analysis extending from collection and cleansing to modeling and implementation.
 Office furniture companies target commercial and corporate workspaces like workstations, cafeterias, conference rooms, and lounges. Most categories in their workshops include seating furniture, overhead bins, storage units, and tables. Furniture companies also sell technology tools like computers, printers, chairs, and office furniture. With the Corona Virus Pandemic, the Office Furniture Sales industry has experienced tremendous growth while transforming the business operation to online purchase. Customers are ordering products online thus making it easier and more convenient for customers to get their orders. As the industry continues to expand, new companies are projected to enter the market while the existing companies strive to invent new strategies to survive in the competitive industry.
Problem Statement
Company K operates a furniture business selling office and home furniture to both individual customers and corporates. The management hired a software company X to develop an online ordering system for customers to purchase furniture while indicating the specification of their order. Over the years the data has accumulated in the company database. While in a discussion with Data Scientist Nick, the CEO of Company X discovered that his company had gold in store ‘data’. The CEO wanted an expert to help him extract some insights from the collected data. The Data Scientist decided to use AWS QuickSight a cloud-based business Intelligence platform to answer some business Questions with regard to CEO’s requests.
Nick was to use AWS QuckSight to provide insights to the CEO by working on a dataset with Furniture, Technology, and Office categories which were further subdivided into more specialized individual items, like chairs, tables. The following are dashboard reports of typical sales data of Company K. The BI team could understand metrics like sales, profit, preferred shipment methods, and popular client segment. The company could drill down to discover which product sells best. An advantage of the QuickSight BI is the ability to share dashboards with users. The BI team answers the following business questions to help in business decisions. Below are charts captured from the QuickSight Dashboard developed for presentation to the management team.
1. Which category, was more profitable across the years, and how much profit was it bringing to the company?
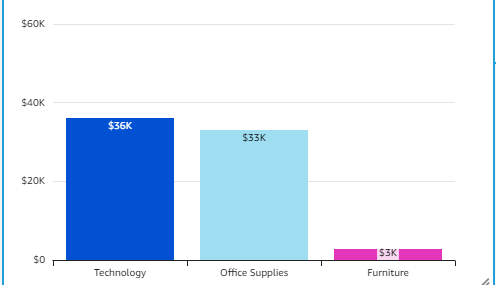 From the above output, it is visible that Technology category gunners the company $36,000 thousand profit, while Office and Furniture $33, 000 and $3,000 profit respectively.
2. Which category sold many products?
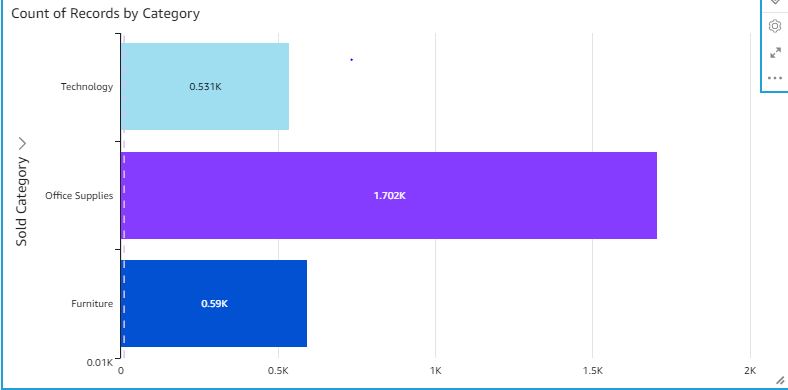
From the above horizontal bar chart, we can discover that Office Supplies sold much with 1,702000 products, followed by Technology and Furniture which sold 59,000 and 53,100 respective. However, despite the huge sale in the Office category, selling much, the Technology category is more profitable. This means the company is using more resources in Office Supplies which is less profitable. The company should, invest more resources in the profitable category.
3. Which customer segment offered the best business deals?
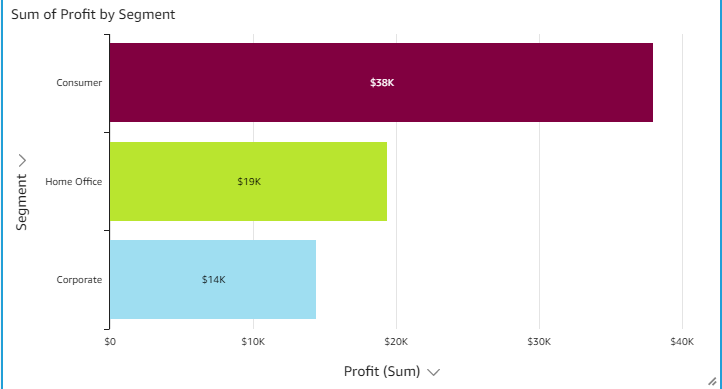 The analysis reveals that individual customers were frequent buyers and gave the company $38,000 profit more as compared to Home Office and Corporate segments which accrued the company $19,000, and $14,000 profit turn-over.
The company should develop a marketing strategy to promote the Corporate segment and Home Office.
The analysis reveals that individual customers were frequent buyers and gave the company $38,000 profit more as compared to Home Office and Corporate segments which accrued the company $19,000, and $14,000 profit turn-over.
The company should develop a marketing strategy to promote the Corporate segment and Home Office.
4. Which deal size was more profitable?
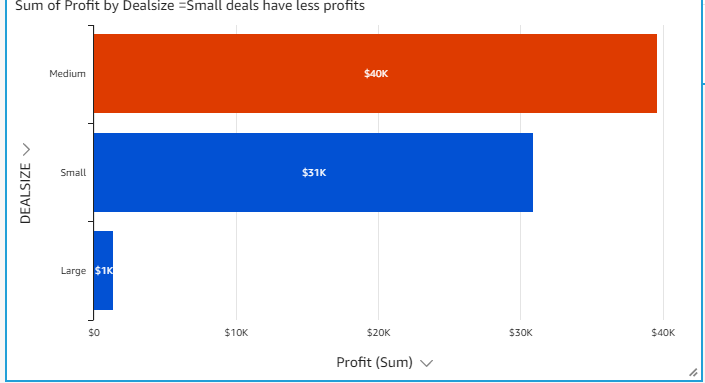
The output above shows that most customers ordered Medium-sized deals. Other customers ordered Small and large deals respectively. This means, most of the customers are of middle-class. However, the corporates and few customers preferred large-sized deals.
It is evident that Medium deals were more profitable with $40,000 followed by Small deals and large deals were less profitable. The company could develop strategies to promote large deals and give targeted promotions to Medium and Small-sized deals’ customers.
5. Which State is bringing the company more business?
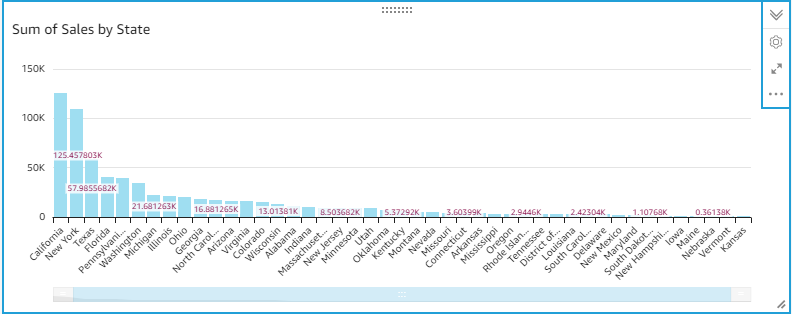
California had many customers, followed by New York, Texas, Florida, Pennsylvania, Washington, Michigan, Illinois, Ohio, Georgia, North Carolina …. but few customers came from Vermont and Kansas.